 |
 |
|
|
| Accueil Technopédagogie / Professeurs / Applications pédagogiques / Tutoriel: WSS  DISPLAY THE RESULTS OF A SURVEY DISPLAY THE RESULTS OF A SURVEY Click on the title of the survey on the Quick Launch (on the left of the home page) or if it is not displayed there, click on ''View All Site Content'' (on the top left). 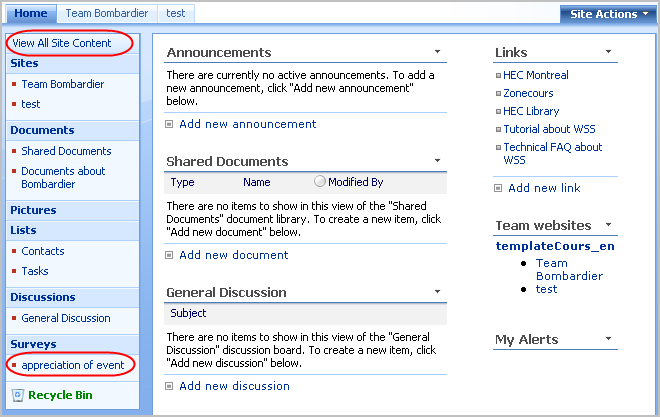 In order to view the frequency at which each answer of the survey was chosen, click on the option "Show a graphical summary of responses". 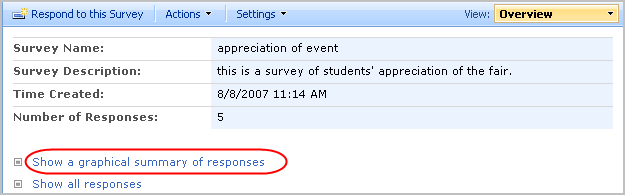 You obtain a histogram showing the frequency at which each answer was given. 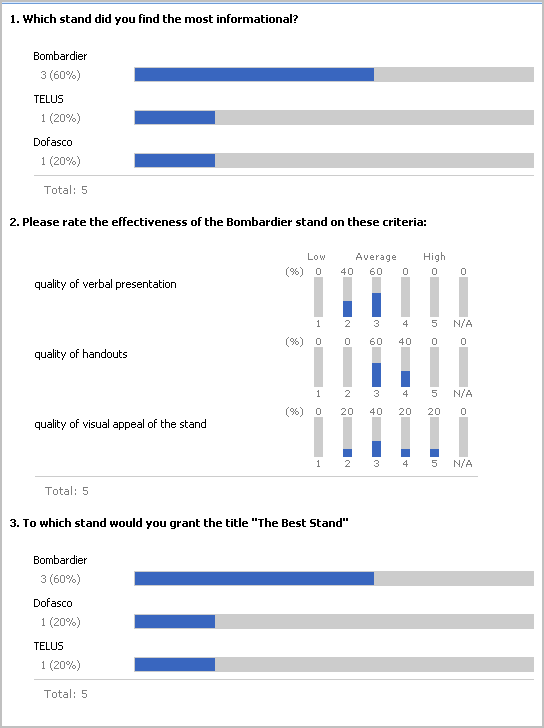 In order to see the individual answers of each respondent, select the option "Show all responses". 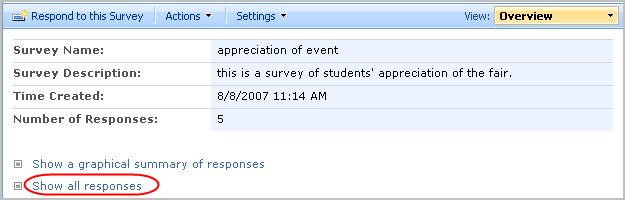 There were 5 respondents to this survey. Since this survey was anonymous, stars are displayed instead of the names of respondents. (It is possible to design surveys that are not anonymous). The option to display the answer of each respondant can be particularly relevant for surveys that are not anonymous. Click on the number of the response (e.g. ''View response 3) whose answers you would like to see.  You can now see the individual answers of the respondent.  Create a Survey Branching of Questions Answer a Survey Section 2: Using a WSS Site |
|
|
|||
|
Dernière mise à jour : 17
août
2006
Technopédagogie, gti.techno@hec.ca © HEC Montréal, 2006. Tous droits réservés. |
HEC
Montréal |
||